※ 참고
나는 html을 정식으로 배운게 아니라서 설명이나 표현이 정확하지 않을 수 있다. 실행에 초점을 맞춰서 작성하는 글이므로 감안해서 읽으면 된다.
naver cloud platform에서는 다양한 기능을 제공하고 있는데, 그 중에서 naver map api를 사용하면 지도 서비스를 만들 수 있다. 이번 글에서는 이전 글에서 만들었던 예제 데이터와 naver map api를 사용해서 지도 서비스를 만들어본다. 기본적인 naver map api 관련 내용은 아래 글에 작성해뒀으니 참고하면 된다.
https://1545154.tistory.com/34
[naver map api] naver cloud platform 등록과정 정리
네이버 지도 api를 사용하면 다양한 작업들을 할 수 있다. 카카오 지도 api와 마찬가지로 네이버 지도 api를 사용하려면 라이선스를 발급받아야 하기 때문에 먼저 라이선스 키를 발급받는 방법에
1545154.tistory.com
https://1545154.tistory.com/35
[naver map api] naver map 그리기
이전 글에서 카카오 지도 api 라이선스 발급과 플랫폼 등록하는 법을 알아보았다. 이번에는 코드를 설명하기 앞서 만들려는 프로그램에 대한 설명을 작성한다. 추가로 visual studio code와 Apache http s
1545154.tistory.com
먼저 naver map 출력하기 위해 index.html과 variable.js 두 개의 파일을 다음과 같이 작성한다. 이런식으로 작업하면 된다.
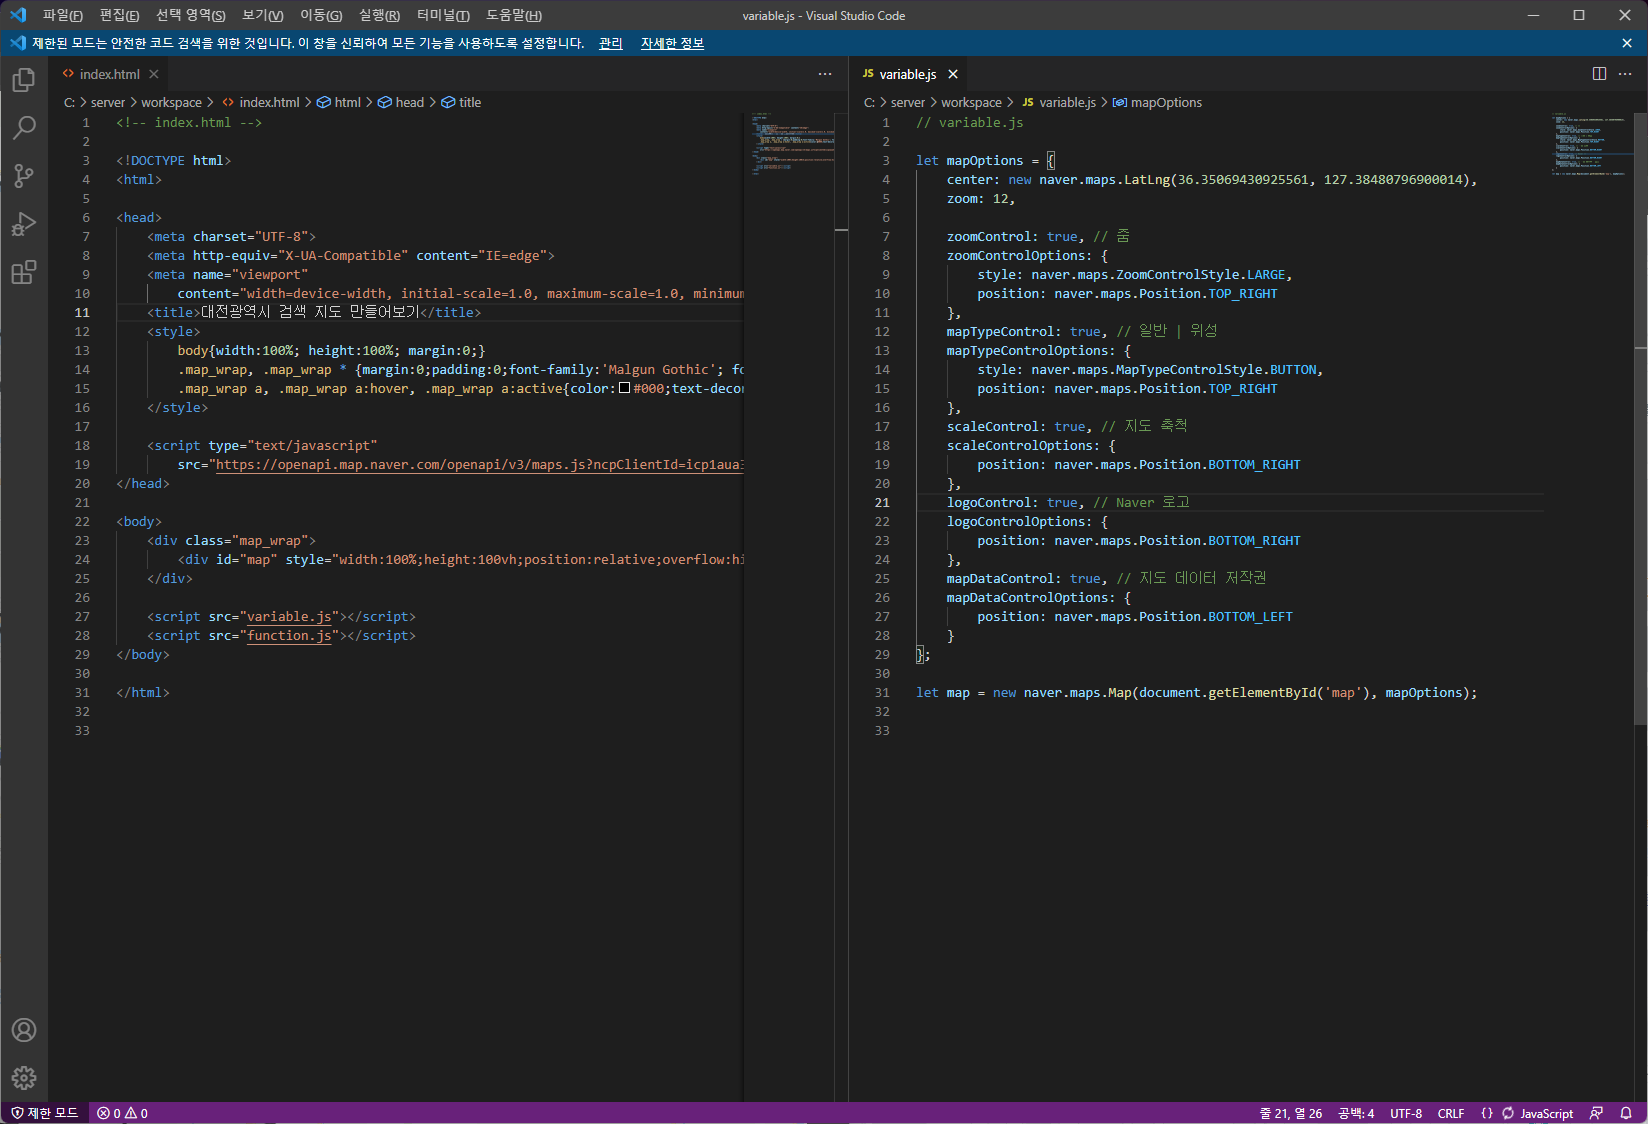
index.html의 <style> body { ... margin:0;} ... </style>에서 margin:0; 옵션을 주지 않으면 약간의 스크롤이 생긴다.
<!-- index.html -->
<!DOCTYPE html>
<html>

<head>
    <meta charset="UTF-8">
    <meta http-equiv="X-UA-Compatible" content="IE=edge">
    <meta name="viewport"
        content="width=device-width, initial-scale=1.0, maximum-scale=1.0, minimum-scale=1.0, user-scalable=no">
    <title>대전광역시 검색 지도 만들어보기</title>
    <style>
        body{width:100%; height:100%; margin:0;}
        .map_wrap, .map_wrap * {margin:0;padding:0;font-family:'Malgun Gothic'; font-size:12px;}
        .map_wrap a, .map_wrap a:hover, .map_wrap a:active{color:#000;text-decoration: none;}
    </style>

    <script type="text/javascript"
        src="https://openapi.map.naver.com/openapi/v3/maps.js?ncpClientId=라이선스키입력&submodules=geocoder"></script>
</head>

<body>
    <div class="map_wrap">
        <div id="map" style="width:100%;height:100vh;position:relative;overflow:hidden;"></div>
    </div>

    <script src="variable.js"></script>
</body>

</html>
variable.js의 center: ...에서 대전광역시청 위경도를 입력해서 지도를 실행시키면 해당 위경도로 지도 중심을 이동한다. 그 아래로는 줌 레벨과 기본 옵션을 설정해줬는데, naver에서 제공해주는 튜토리얼과 별로 다를건 없다.
// variable.js

let mapOptions = {
    center: new naver.maps.LatLng(36.35069430925561, 127.38480796900014),
    zoom: 12,

    zoomControl: true, // 줌
    zoomControlOptions: {
        style: naver.maps.ZoomControlStyle.LARGE,
        position: naver.maps.Position.TOP_RIGHT
    },
    mapTypeControl: true, // 일반 | 위성
    mapTypeControlOptions: {
        style: naver.maps.MapTypeControlStyle.BUTTON,
        position: naver.maps.Position.TOP_RIGHT
    },
    scaleControl: true, // 지도 축척
    scaleControlOptions: {
        position: naver.maps.Position.BOTTOM_RIGHT
    },
    logoControl: true, // Naver 로고
    logoControlOptions: {
        position: naver.maps.Position.BOTTOM_RIGHT
    },
    mapDataControl: true, // 지도 데이터 저작권
    mapDataControlOptions: {
        position: naver.maps.Position.BOTTOM_LEFT
    }
};

let map = new naver.maps.Map(document.getElementById('map'), mapOptions);
작성하고 index.html을 실행시켜보면 다음과 같은 지도를 얻을 수 있다.

이전에 만들었던 대전광역시 시군구 레이어를 지도에 출력하기 위해 function.js 파일을 만들어서 다음과 같이 작성하고 index.html 파일을 수정한다.
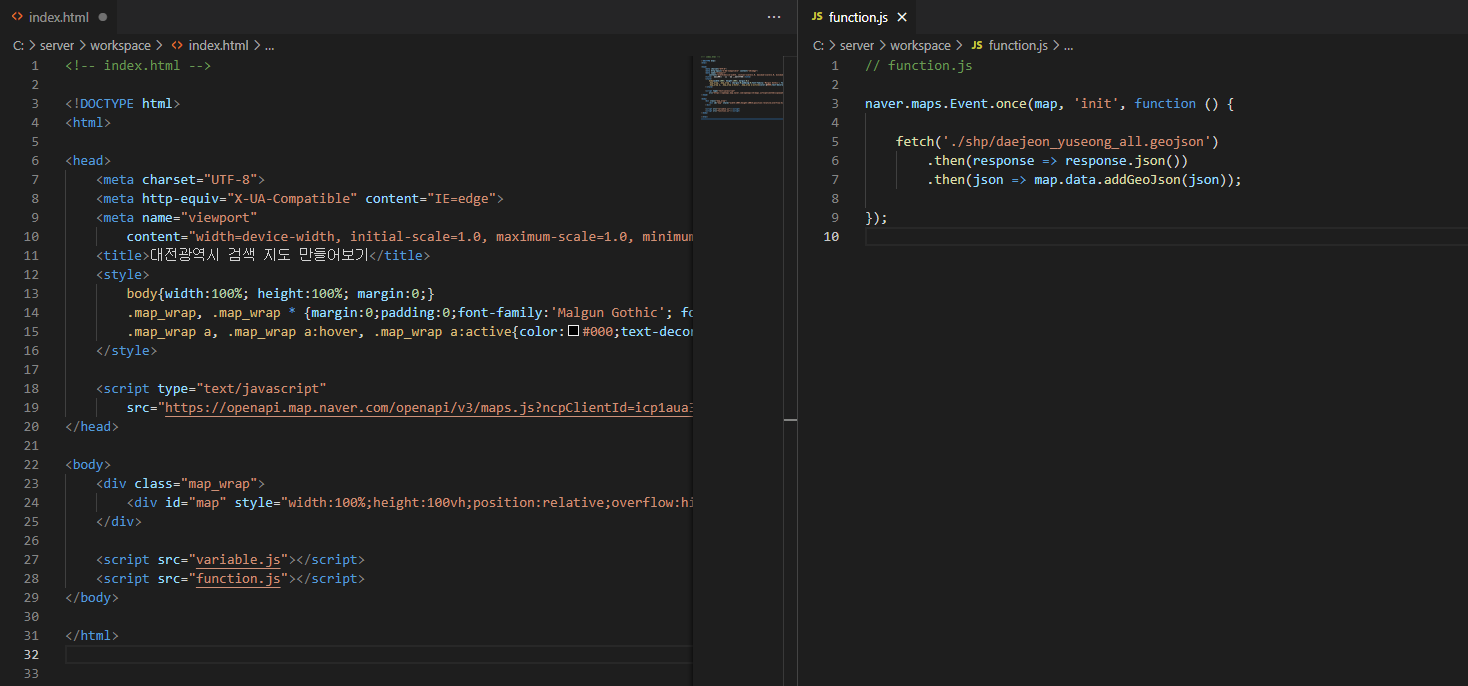
function.js의 naver.maps.Event.once()는 이름대로 index.html이 실행되면 그 안의 내용이 딱 한 번만 실행된다. json 레이어는 fetch()를 사용해서 읽어올 수 있다. json file을 읽어와서 map.data.addGeoJson()으로 지도에 출력한다.
// function.js

naver.maps.Event.once(map, 'init', function () {
    fetch('./shp/daejeon_yuseong_all.geojson')
        .then(response => response.json())
        .then(json => map.data.addGeoJson(json));
});
index.html의 맨 아래쪽에 function.js를 추가하면 된다.
<!-- index.html -->

<!DOCTYPE html>
<html>

<head>
    ...
</head>

<body>
    <div class="map_wrap">
        ...
    </div>

    <script src="variable.js"></script>
    <script src="function.js"></script>
</body>

</html>
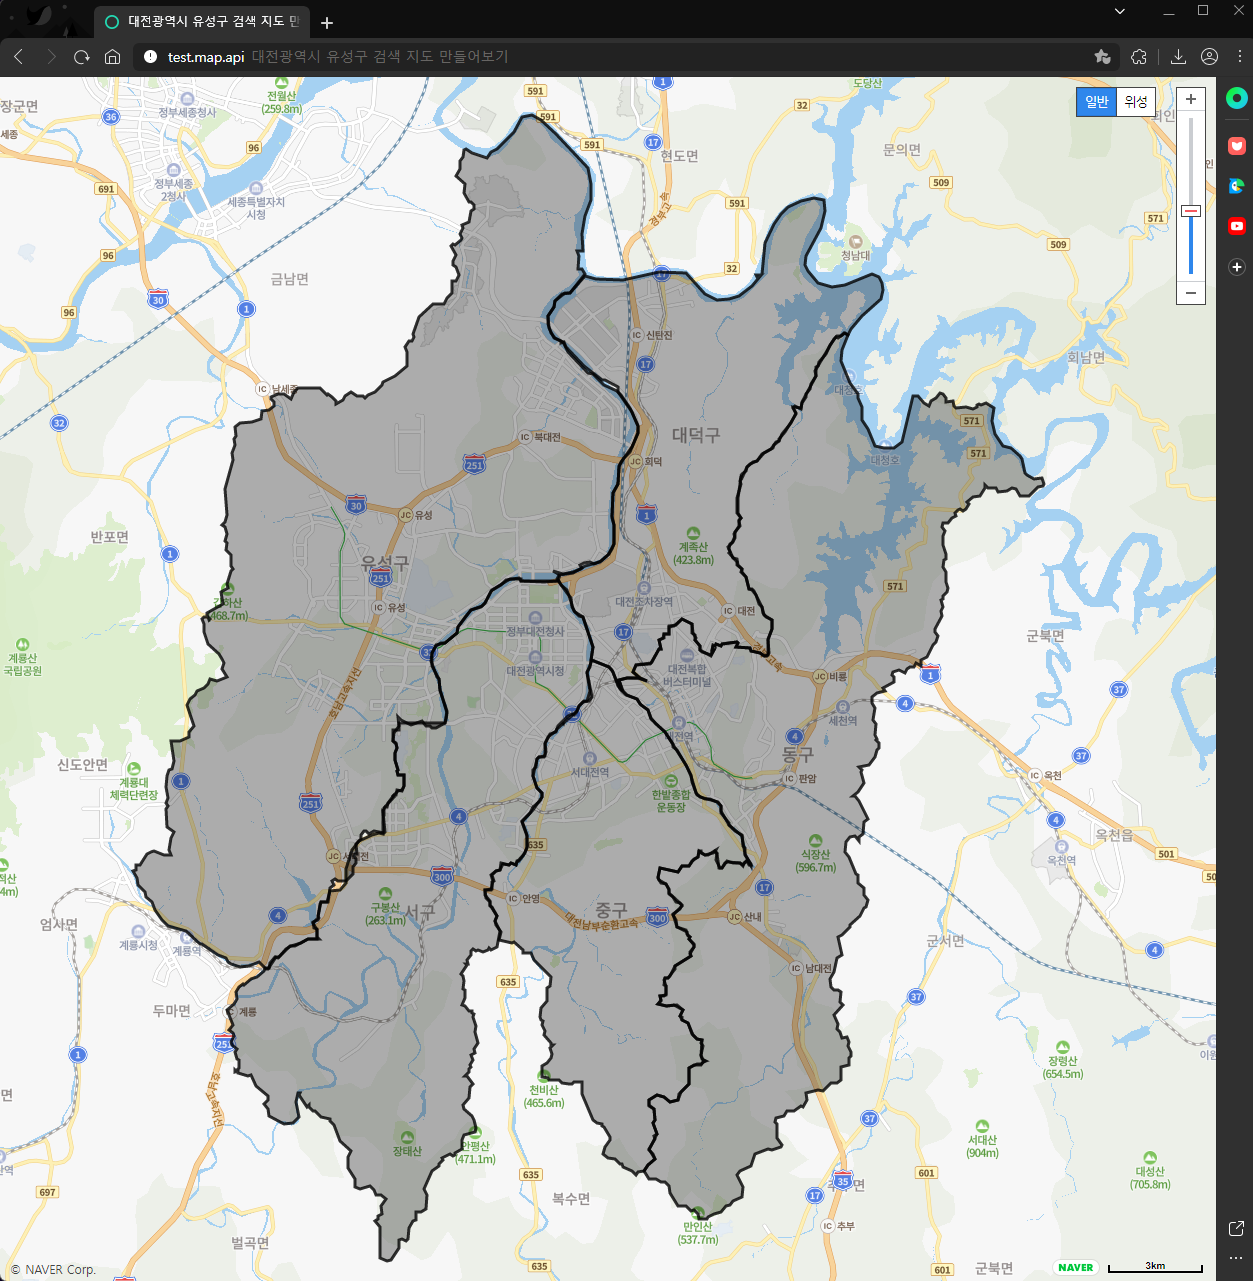
작성하고 index.html을 실행시켜보면 다음과 같은 레이어를 확인할 수 있다.
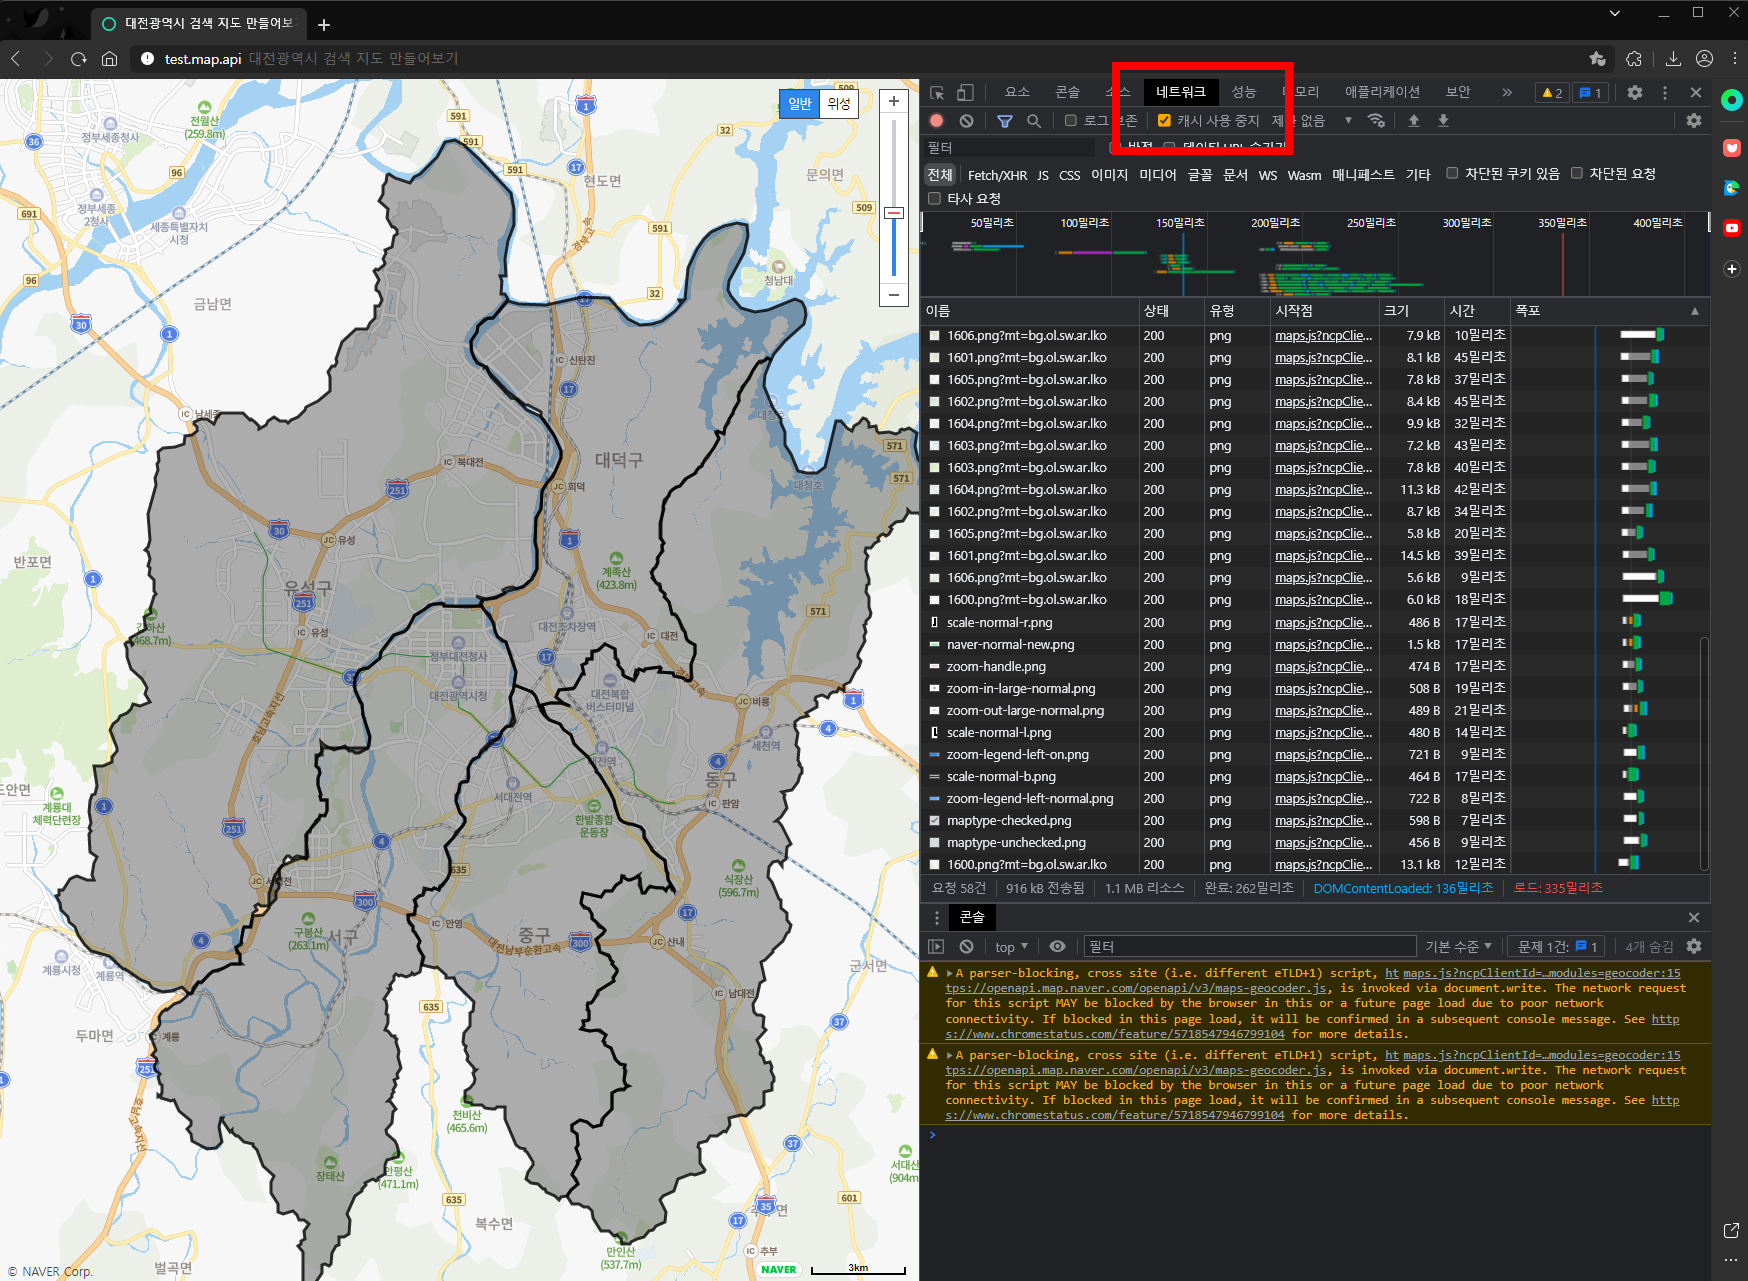
아! index.html 새로고침 할 때는 개발자도구 - 네트워크에서 캐시사용중지를 활성화시킨 상태에서 새로고침을 해야한다. 이렇게 하지 않으면 코드를 수정하고 새로고침을 해도 반영되지 않을 때가 많다.
시군구 레이어 위에 읍면동 레이어도 올린다. function.js에서 읍면동 레이어를 읽어와서 출력해주면 된다.
// function.js

naver.maps.Event.once(map, 'init', function () {
    fetch('./shp/daejeon_yuseong_all.geojson')
        .then(response => response.json())
        .then(json => map.data.addGeoJson(json));

    fetch('./shp/daejeon_yuseong_Administrative.geojson')
        .then(response => response.json())
        .then(json => map.data.addGeoJson(json));
});
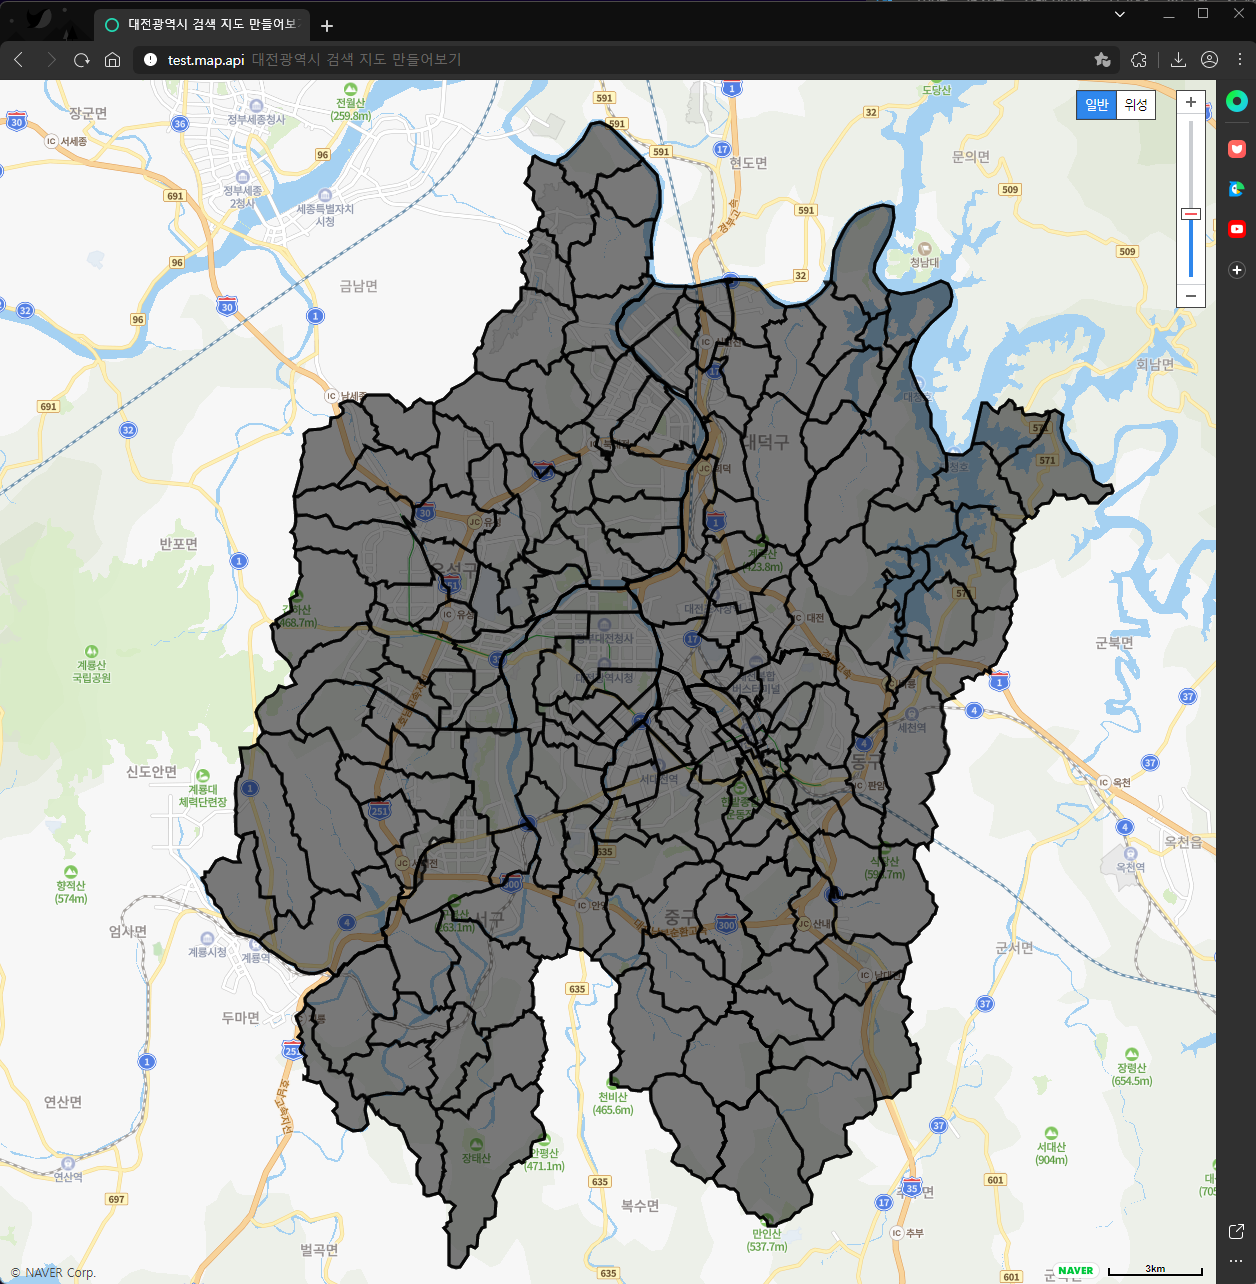
작성하고 index.html을 실행시켜보면 다음과 같은 레이어를 확인할 수 있다.
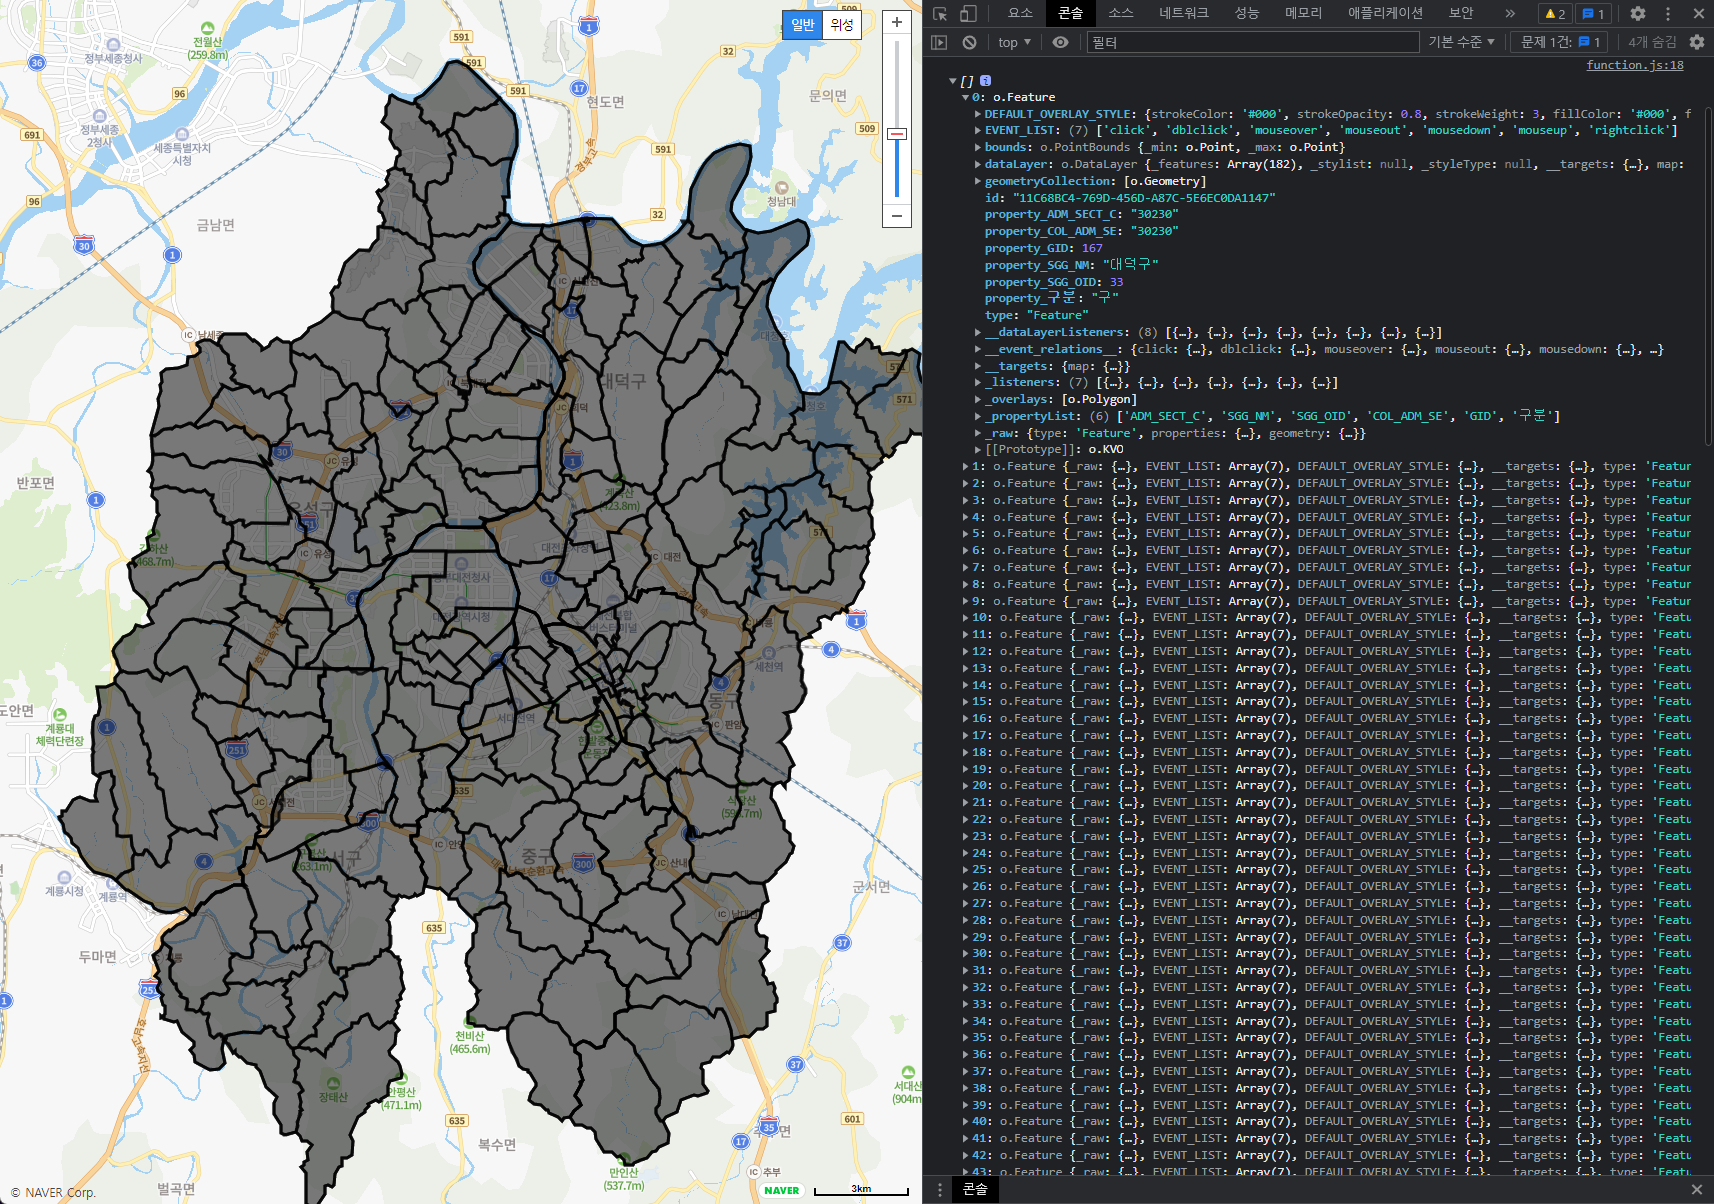
지금까지 올라간 레이어는 map.data.getAllFeature() 함수로 확인할 수 있다.
// function.js

naver.maps.Event.once(map, 'init', function () {
    ...
});

let layer = map.data.getAllFeature();
console.log(layer);
분명 우리는 두 개의 파일만 작성했던 것 같은데 출력해보면 꽤 많은 레이어들이 올라가 있다. 이는 geojson file에 저장되어 있는 하나의 컬럼당 하나의 레이어라고 생각하면 된다.
여기까지 naver map 위에 레이어를 올리는 방법에 대해 알아보았다. 다음 글에서는 레이어에 색을 입히고 이벤트를 설정하는 방법에 대해 알아본다.
'공부 > naver map api' 카테고리의 다른 글
| [naver map api 예제] 레이어 분할하기 (0) | 2022.03.09 |
|---|---|
| [naver map api 예제] 레이어 색 변경 및 마우스 이벤트 설정 (0) | 2022.03.08 |
| [naver map api 예제] QGIS로 예제 데이터 만들기 (0) | 2022.03.04 |
| [naver map api 예제] 소개 (0) | 2022.03.04 |
| [naver map api] 정리 (0) | 2022.01.27 |


댓글